How to Benchmark Your Reels Against Competitors (Step-by-Step)
Benchmark reels against competitors with a repeatable scorecard, growth-rate tracking, CSV exports, and a weekly review ritual—without guessing from screenshots.

You can post Reels every week and still lose ground in your niche. The gap is usually measurement, not effort. Creators who benchmark reels against competitors on a schedule know which formats are winning now, how their median Reel stacks up, and which rival clip is picking up speed.
Pick a rival set, collect comparable metrics, fill a comparison scorecard, and review it weekly. Browser tools, a spreadsheet, and 30–45 minutes are enough when the cadence stays fixed.
What “benchmarking Reels” actually means
Benchmarking is not copying a viral hook or refreshing a rival’s profile once a month. For short-form video, it means comparing your Reels performance to a fixed competitor cohort using the same metrics, time window, and update cadence.
| Question benchmarking answers | What it is not |
|---|---|
| Are my new Reels reaching rival median views in 7 days? | Chasing one old viral clip |
| Which competitor formats gained views fastest this week? | Account follower count alone |
| Did our engagement-per-view improve vs. last month? | A single screenshot of their grid |
| What should we test next based on data? | Posting more without a hypothesis |
Account-level tools such as Instagram Competitive Insights help with follower and interaction trends, but they rarely replace per-Reel ranking and velocity between visits. For native limits, see Instagram Competitive Insights: What It Misses. For ongoing rival monitoring, pair this scorecard with an Instagram Reels competitor tracker workflow.
Before you start: benchmark cohort and cadence
Cohort (3–8 rivals) — Accounts in the same niche and audience size band—not only the biggest creator in the category. Include one “aspirational” account and two peers near your follower count.
Cadence — Weekly is enough for most creators; agencies often run twice weekly during a campaign. Pick the same weekday and time so view counts are comparable.
Metrics — At minimum: views per Reel, post date, and change since last check. Add likes, comments, or engagement rate when your tool exposes them on public profiles.
Storage — A scorecard tab plus dated CSV exports. If you report to clients, plan for export Instagram Reels data to CSV from your tracker.
Note
Benchmark public Reels data only. Private accounts and metrics Instagram does not show on the Reels tab are out of scope. Use official browser sessions and respect Instagram’s terms.
Reels benchmark scorecard template (copy this)
Use one row per account per review period. Copy the table into Google Sheets or Notion and duplicate the block each week.
| Field | Your account | Competitor A | Competitor B | Competitor C | Notes |
|---|---|---|---|---|---|
| Review date | YYYY-MM-DD | same | same | same | Same day for all |
| Followers (snapshot) | Context only | ||||
| Reels posted (last 14d) | Cadence signal | ||||
| Median views — last 5 Reels | Core benchmark | ||||
| Top Reel views (last 14d) | Ceiling, not median | ||||
| Fastest-growing Reel (7d delta) | Link + title in Notes | ||||
| Median ER% (if available) | Likes+comments / views | ||||
| Avg Reel length (sec) | Format pattern | ||||
| Posts per week (Reels) | Volume vs. quality | ||||
| Score vs. cohort median | — | ↑ / → / ↓ | ↑ / → / ↓ | ↑ / → / ↓ | Your median vs. theirs |
| Action for next week | One test per account |
Scoring shorthand
- ↑ Above cohort median on median views (last 5 Reels) or on 7-day growth on your newest Reel
- → Within ~15% of cohort median
- ↓ Below cohort — prioritize format or hook tests, not more volume alone
Add a second tab for Reel-level detail when one clip breaks out:
| Reel URL / title | Account | Post date | Views (today) | Views (last check) | 7d growth % | Hook / format tag |
|---|---|---|---|---|---|---|
How to benchmark your Reels against competitors (10 steps)
Step 1: Lock your competitor list
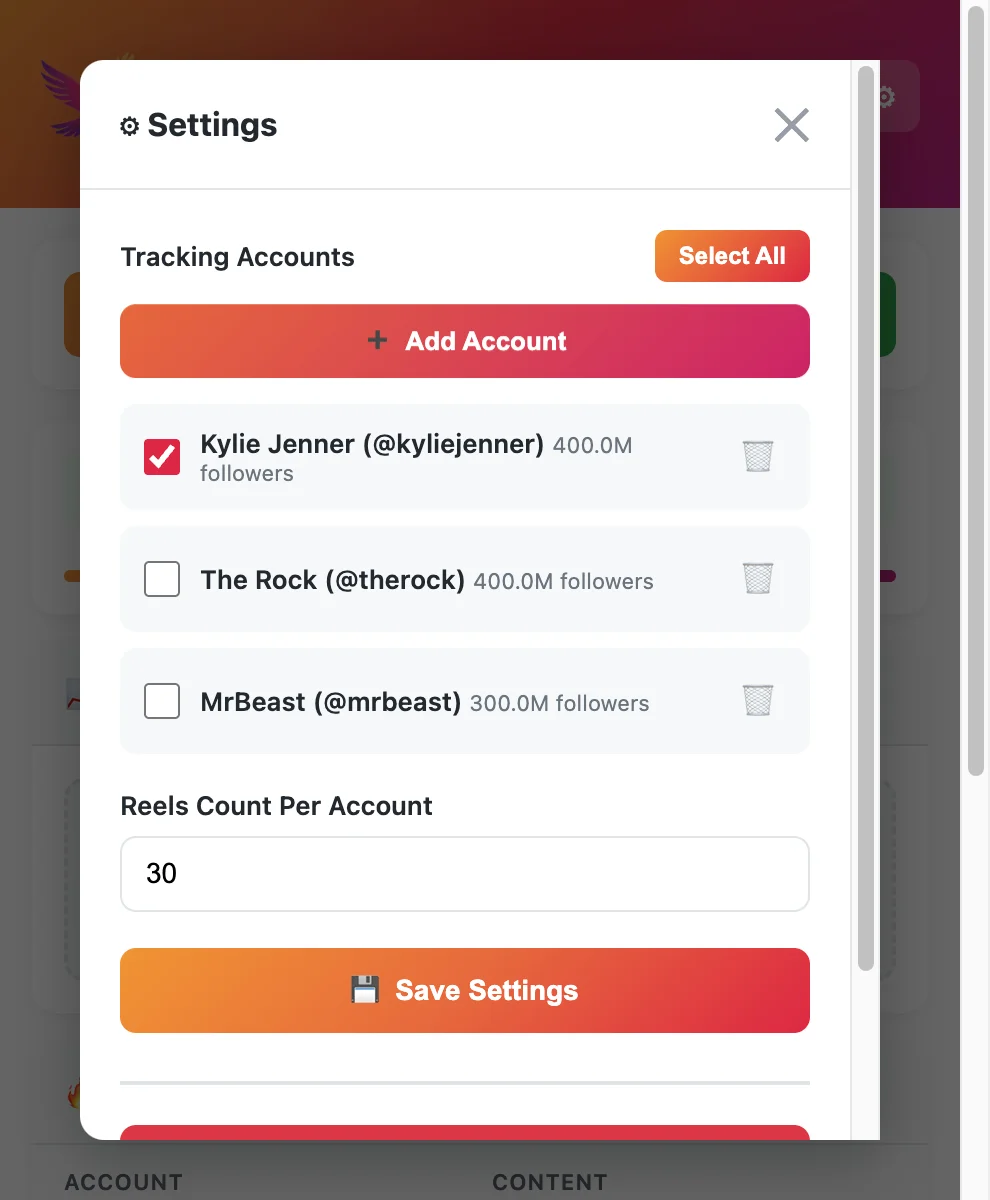
Write 3–8 handles in a doc called benchmark-cohort-2026. Criteria: same niche, overlapping audience, mix of peer and aspirational size. Remove accounts that post once a month unless you only care about their rare hits.
Revisit the list quarterly. Brands entering your niche matter more than a dormant account with one viral Reel from 2023.
Step 2: Capture your own baseline in Insights
Open Instagram Insights on your Professional account. For your last 5–10 Reels, note plays, reach, saves, and shares where available. This is your owned truth layer—extensions complement it but do not replace it for distribution sources.
Record the same fields you will use for rivals so the scorecard compares apples to apples.
Step 3: Run a first-pass sort on each rival’s Reels tab
Instagram does not rank a competitor’s Reels grid by view count. Open each profile’s Reels tab in the browser, then use a sort-capable tool from our free Instagram Reels tracker tools roundup (IShort, Sort Feed, EagleReels, etc.).
Sort by views descending—see sort Instagram Reels by views for extension specifics. Export or copy the top 10–20 rows if the tool allows. Label files handle_YYYY-MM-DD.csv.
Step 4: Log median performance—not only the #1 Reel
The top Reel on an account is often years old. For benchmarking, calculate median views of the last 5 Reels (or last 14 days) per account. Enter those medians in the scorecard template.
If your median trails every rival’s median, the issue is systemic (format, hook, length, posting time)—not bad luck on one upload.
Step 5: Add velocity with view growth rate
Total views hide breakouts. On your second visit (same weekday next week), sort or filter by view growth since last check. Full methodology: How to Track Reels View Growth Rate.
Flag any rival Reel whose views rose 30%+ in seven days even if it is not their all-time top. Those clips signal what the algorithm is pushing this week.
Step 6: Fill the comparison scorecard
Transfer medians, top-14-day Reel, fastest-growing Reel, and posting cadence into the template. Mark ↑ / → / ↓ for your account vs. each competitor column.
Write one Action for next week line per review—e.g., “Test 45s tutorial hook style like Competitor B’s top 14d Reel” or “Reduce posting to 3/week until median views recover.”
Step 7: Export and archive CSV snapshots
Scorecards drift if you only keep numbers in memory. Export ranked Reels after each sort pass and store with the review date. Step-by-step export habits live in export Instagram Reels data to CSV.
Agency tip: one folder per client, subfolders per YYYY-MM-DD review, never overwrite the previous CSV.
Step 8: Compare format patterns, not just numbers
Views tell you what won; patterns tell you why to test. From sorted exports, tag:
- Length bucket (under 30s, 30–60s, 60–90s)
- Hook type (question, listicle, POV, demo)
- Audio (original vs. trending)
- CTA (comment keyword, link in bio mention, none)
When three rivals spike with the same length and hook style, that is a stronger brief than one viral outlier.
Step 9: Set one experiment per week
Benchmarking without action is a report nobody acts on. From Step 6 actions, pick one change: new hook template, length band, posting window, or series format. Publish 2–4 Reels that test it—hook and retention tactics live in how to increase Reels views.
Next review, check whether your median views (last 5) moved ↑ toward the cohort. Keep experiments in one slot of your Instagram growth strategy.
Step 10: Run the ritual on a calendar
Block 30–45 minutes. Suggested order:
- Update tracker / re-sort all cohort accounts
- Refresh scorecard medians and growth column
- Export CSVs
- Note breakout Reels in the detail tab
- Assign next week’s single experiment
Tools that store multi-account panels cut Steps 3–5 from “open twenty tabs” to one pass—useful when you operationalize the competitor Reels tracker guide alongside this scorecard.
Example: reading the scorecard after one month
Suppose your median views (last 5 Reels) sit at 4.2K while three peers cluster at 6–8K (↓). Your fastest-growing Reel gained 18% in 7 days while Competitor B’s newest gained 52% (↑ for them, gap for you).
Interpretation:
- You are not under-posting (your Reels/week matches peers).
- Median gap suggests format or retention, not frequency.
- Competitor B’s growth row points to a specific clip to storyboard—not their 2024 viral still at the top of a view sort.
Action: replicate the structure (hook in 2s, demo body, 40s length), not the topic verbatim.
Benchmarking methods compared
| Method | Unit of analysis | Reels velocity | Export | Best for |
|---|---|---|---|---|
| Instagram Competitive Insights | Account trends | Limited | No Reels CSV | Macro follower/interaction checks |
| Manual Reels tab scroll | Per-Reel | No history | Screenshots only | Quick one-off looks |
| Sort-by-views extension | Per-Reel | Snapshot only | Often CSV | Weekly ranked lists |
| Tracker with growth rate | Per-Reel + history | Yes, between visits | CSV / report | Ongoing rival monitoring |
| Scorecard + CSV archive | Cohort summary | When you log deltas | Your spreadsheet | Client reporting, strategy reviews |
Most teams hybridize: Competitive Insights monthly, scorecard + extension weekly. Pick tools from the free Reels tracker comparison when you need competitor depth without a full SaaS stack. Account-wide checks beyond Reels still belong in free Instagram analytics tools—this scorecard stays clip-level.
Common benchmarking mistakes
Chasing lifetime view kings — Sorting only by all-time views overweights old virals. Always pair with recent median and 7-day growth.
Changing the cohort every week — Trends become noise. Swap at most one rival per month unless the niche shifted.
Benchmarking followers only — Follower growth does not tell you which Reel format to shoot tomorrow.
Skipping dates on exports — View counts change hourly. Every CSV needs exported_at in the filename or column.
No single weekly experiment — Data without a test is a dashboard nobody opens.
Ignoring your Insights layer — Rival data is directional; your saves, shares, and reach sources explain whether your distribution is follower-heavy or breaking out.
Metrics that belong on every benchmark review
| Metric | Why it matters |
|---|---|
| Median views (last 5 Reels) | Fair “typical performance” vs. one outlier |
| View growth % (7d) | Surfaces breakouts early |
| Reels posted (14d) | Separates volume from quality |
| Engagement rate (when visible) | Quality signal beyond raw plays |
| Posting cadence | Detects rival sprint weeks |
| Format tags | Turns numbers into creative briefs |
When growth rate is the main decision signal, treat track Reels view growth rate as the deep dive and this article as the cohort scorecard layer on top.
FAQ
Frequently Asked Questions
Where to start
To benchmark reels against competitors reliably: fix a cohort, log medians and growth—not just lifetime tops—fill the scorecard template every week, archive CSV exports, and ship one creative test from each review.
Insights stays your owned-data anchor; extensions and trackers handle public rival Reels at scale. Pair the scorecard with sort by views and free Reels tracker tools when you operationalize the workflow.
EagleReels on the Chrome Web Store — free install.
Last updated: June 5, 2026. EagleReels is not affiliated with Instagram or Meta. Public metrics and tool limits may change—verify vendor pages before client workflows.
Related articles:
- Instagram Reels Competitor Tracker
- How to Track Reels View Growth Rate
- Export Instagram Reels Data to CSV
- Free Instagram Reels Tracker Tools Compared
- Sort Instagram Reels by Views and Growth
- How to Increase Reels Views
- Instagram Growth Strategy 2026
- Free Instagram Analytics Tool
- Instagram Competitive Insights: What It Misses
Ready to track your Instagram Reels performance?
Download EagleReels Chrome extension and start analyzing your Reels today. It's free!
Download EagleReelsRelated Articles

Data-Driven Instagram Reels Content Strategy (Competitor Data)
Build a data-driven Instagram Reels content strategy using competitor data—tracking workflows, growth signals, test calendars, and tools that beat guesswork.

Best Chrome Extensions for Instagram Reels Analytics in 2026
Compare the best Chrome extensions for Instagram Reels analytics in 2026—sorting, growth rate, exports, privacy, and which extension fits creators vs. agencies.

Instagram Reels Competitor Tracker: How to Monitor Rivals in 2026
Learn how an Instagram Reels competitor tracker works—weekly workflow, tools compared, metrics to watch, and alternatives when Competitive Insights is not enough.