How to Spot Viral Reels Before They Peak Using Growth Signals
Learn how to spot viral Reels before they peak—view growth rate, competitor scans, algorithm context, and a weekly workflow using public growth signals.

A Reel that looks small on Monday can own your niche feed by Friday. Creators who adapt fast read growth signals: how fast views climb between checks, whether engagement keeps pace, and whether distribution is still widening—not a single lifetime view count.
Below: how to spot viral Reels before they peak with repeatable metrics and a lightweight competitor workflow—which signals matter, why lifetime sorts lie, and how to pair velocity with Instagram Reels algorithm context before you clone a hook.
Why lifetime view count misleads trend scouts
Open any public Reels tab and sort by views. The top row is almost always an old hit—a clip that peaked months ago and still leads on paper. That list tells you what won in the past, not what is winning right now.
Viral momentum is a rate problem, not a total problem:
| Signal | What it tells you | Blind spot |
|---|---|---|
| All-time views | Historical winners | Hides new breakouts |
| Views in last 7 days (if visible) | Recent interest | No baseline between your visits |
| View growth between updates | Acceleration since your last scan | Needs scheduled re-checks |
| Engagement vs. views | Quality of attention | Harder on competitors; strong on your Insights |
Teams that monitor competitor Reels on a calendar—not when someone drops a screenshot in Slack—catch formats earlier because they log delta, not snapshots.
Growth signals that predict a Reel is still climbing
Think of "viral before peak" as early distribution, not final fame. A clip can be viral-in-progress at 40K views if it gained 35K since Tuesday. These signals stack; none alone is proof.
1. View growth rate (primary signal)
View growth rate compares public view counts between two updates on the same Reel. A dedicated tracker stores the last snapshot and ranks which clips gained the most views since you last looked.
That is the metric most sort-by-views tools skip. Full methodology lives in How to Track Reels View Growth Rate—here is the operational rule:
- Run updates on a fixed schedule (twice weekly for fast niches, weekly for slower B2B).
- Flag any Reel in the top decile of growth for that account and above your niche median.
- Ignore one-off spikes until a second update confirms the slope.
A Reel that jumps from 8K to 45K views between checks while the account's median post adds 2K is a stronger scout signal than a 500K lifetime leader adding 1K.
2. Engagement velocity (secondary)
On your Reels, Instagram Insights shows saves, shares, and comments relative to reach. For competitors, you usually only see public likes and comments—still useful as a ratio:
- High likes with flat views → audience loved it but distribution stalled (may be niche, not breakout).
- Rising views with rising comments → conversation is spreading with the clip.
- Comments outpacing likes on tutorial formats → strong save/share intent (people ask questions).
You cannot see competitor saves. Treat engagement velocity as a confirming layer, not the lead signal.
3. Posting age vs. performance tier
Breakouts often show up in the first 48–72 hours after publish, then get a second wind if Instagram tests them to non-followers. When scouting:
- Prioritize Reels posted in the last 14 days that already rank in the account's top 25% by growth rate.
- Deprioritize ancient top-view clips unless growth rate resurges (remix trends, seasonal search).
4. Distribution context (algorithm layer)
Even perfect velocity can be a one-account anomaly—a creator's audience sharing internally without Explore lift. Cross-check against algorithm behavior:
- Original audio vs. trending audio mix on the account's recent hits.
- Whether the format matches topics audiences now control via "Your Algorithm" preferences (algorithm guide).
- Posting cadence: one breakout among five flops is a test; three similar hooks accelerating is a pattern.
Velocity tells you what to watch; algorithm context tells you whether to replicate.
5. Cross-account pattern match
Viral rarely stays inside one handle. When three competitors in your set show the same hook structure gaining growth rate in the same week, you are looking at a niche wave, not luck. That is why multi-account panels beat opening profiles one at a time.
The "before peak" window: what it looks like in practice
"Before peak" does not mean secret data. It means you act while the curve is still steep:
Views
  |     peak plateau
  |        ___________
  |       /
  |      /  ← scout + test window (steep slope)
  |     /
  |____/
      time →
Scout window: growth rate high, total views still moderate, format repeatable.
Late window: total views dominate sorts; growth rate flat; everyone already copied the hook.
Operators who only sort by views work in the late window. Operators who sort by growth rate signals work in the scout window.
Weekly workflow: spot viral Reels in under an hour
This workflow assumes public competitor accounts you can view in a logged-in browser session.
Step 1 — Lock your competitor set (15 minutes, once)
Choose 8–12 accounts in your size band (within roughly 3× your follower count) plus 2 aspirational larger accounts. Document:
- Primary format (talking head, demo, meme, UGC-style)
- Posting frequency
- Last breakout note (from memory or prior export)
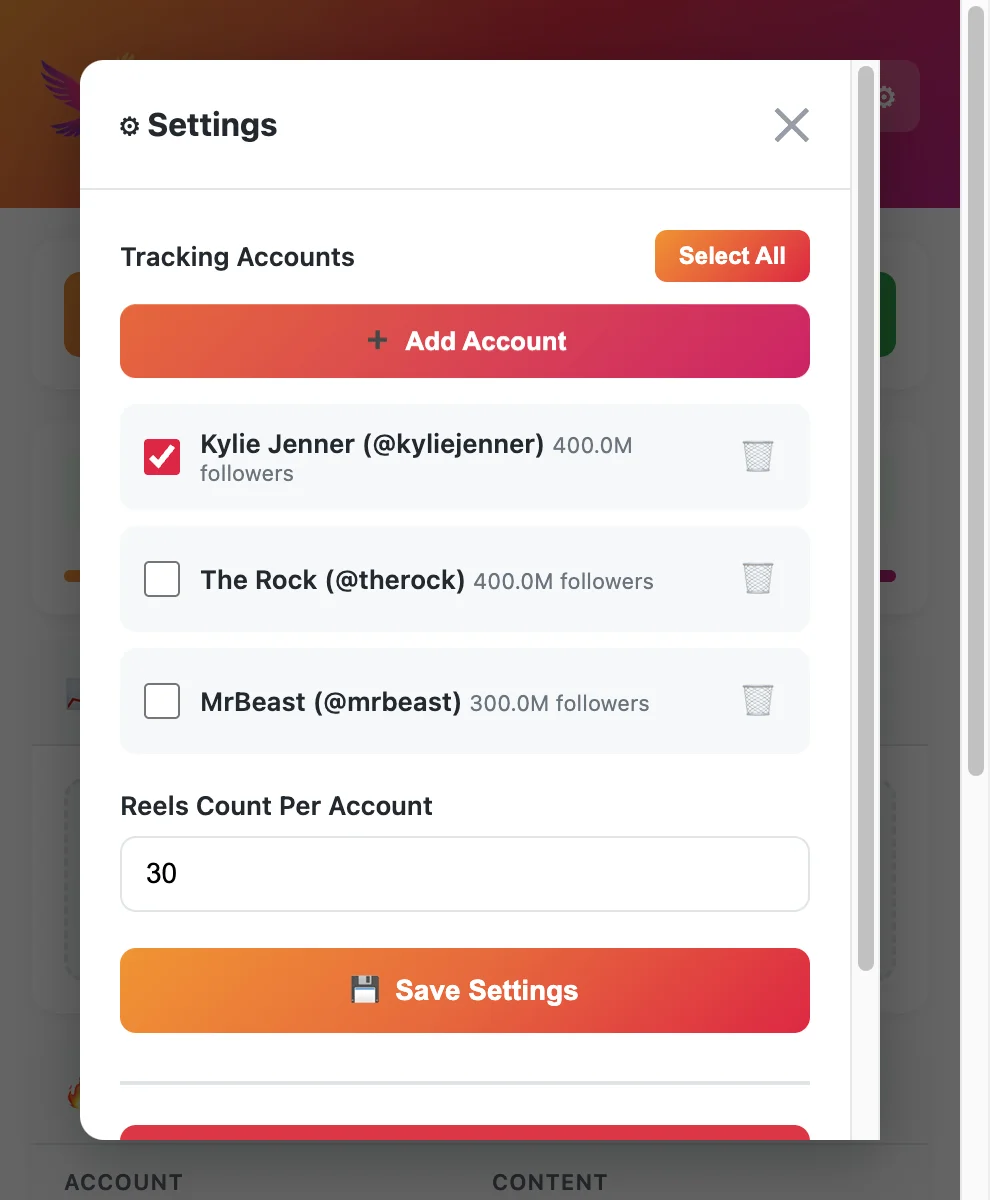
Add handles to your Instagram Reels competitor tracker panel or spreadsheet column—consistency matters more than tool brand.
Step 2 — Baseline update (day one)
Run a full capture on every account. Export or screenshot:
- Top 10 by lifetime views (context)
- Top 10 by view growth since last update (signal)
- All Reels posted in the last 7 days with metrics
Label the file with date and time. Growth math is only comparable across similar intervals.
Step 3 — Scheduled re-check (Tuesday + Friday or weekly)
Re-run updates at the same time of day. Sort by growth rate first, not views.
Flag rules (simple version):
- Growth rate in top 20% of that account's library this week.
- Posted within 14 days (or regaining growth after day 30—rare, note it).
- Same hook or visual pattern appears on 2+ accounts in your set.
Step 4 — Qualitative pass (10 minutes)
For each flagged Reel, note:
- First 1–2 seconds (hook type)
- Length bucket (under 15s, 15–30s, 30–60s)
- Caption CTA pattern
- Audio type (original, trending, voiceover-only)
Numbers tell you which clip; notes tell you what to test on your channel this week.
Step 5 — Validate before you produce
Ask:
- Is this breakout repeatable for my brand, or spectacle I cannot match?
- Did the account's other recent Reels also rise, or is this an outlier?
- Does Reels algorithm context support wider distribution (originality, topic match)?
If yes, add one test Reel to your calendar—not a full content pivot from a single viral hit.
Tip
Speed tip: Pin a Reels tracker extension and run growth-rate sorts before you scroll for inspiration. Operators in r/InstagramMarketing use the same trick to stop mistaking old viral clips for this week's trend.
Tooling: what you need (and what you can skip)
You do not need enterprise social listening to spot viral Reels early. You need update history and sortable public metrics.
| Approach | Pros | Cons |
|---|---|---|
| Manual screenshots | Free | No velocity; easy to misremember |
| Sort-by-views extension | Fast on one profile | Favors old winners |
| Multi-account tracker + growth rate | Panel + delta between visits | Requires browser session; free caps |
| Account-wide SaaS | Polished reports | Often weak per-Reel competitor velocity |
Pair a growth-rate-capable tracker with the workflow above. Compare extension options in free Instagram Reels tracker tools; deeper signal math is in track Reels view growth rate.
False positives: when not to call it viral
Growth rate highlights candidates; it does not guarantee Explore scale.
Watch for:
- Paid or collab spikes — Sudden view jumps with flat engagement can be promotion, not organic breakout.
- Giveaway or comment-bait hooks — High comments, weak save intent; may not travel to non-followers.
- Reposted or aggregator accounts — Algorithm penalties for unoriginal content can cap distribution even if early views look hot.
- Platform glitches or rounding — Rare, but huge one-hour jumps that vanish on the next update should be discarded.
- Out-of-niche viral — A meme Reel can explode for an account whose product tutorials do not move; do not copy the wrong layer.
When in doubt, wait for a second scheduled update. Real momentum usually continues one more interval; fakes flatten.
From signal to content test (keep the loop tight)
Spotting viral Reels is not stalking—it is R&D. Translate each flagged clip into one test hypothesis:
| Observation | Test on your account |
|---|---|
| "Question hook + 12s demo" rising on 3 rivals | One Reel, same hook structure, your product |
| POV walkthrough format accelerating | Two variants with different CTAs |
| Trending audio + text-on-screen pattern | One original-audio control to satisfy originality scoring |
Log results in the same spreadsheet as competitor flags. After four weeks you will see which patterns you imported successfully, not just which competitor won once.
Metrics cheat sheet (printable)
| Metric | Use for scouting | Use for your own Reels |
|---|---|---|
| View growth between updates | Lead signal | Compare Insights plays week over week |
| Lifetime views | Context only | Portfolio benchmarks |
| Likes / views ratio | Confirm interest | Insights engagement rate |
| Saves / shares | N/A on rivals | Distribution quality |
| Post age | Filter new breakouts | Time-to-first-1K plays |
| Cross-account pattern | Niche wave detection | Positioning decisions |
FAQ
Frequently Asked Questions
Where to start
Spot viral Reels before they peak by tracking growth between visits, not lifetime leaderboards. Lock a competitor set, run scheduled updates, rank by view growth rate, confirm with engagement shape and cross-account patterns, then sanity-check against algorithm context before you produce.
Treat scouting as calendar work—same day, same accounts, same metrics—so breakouts surface while you still have time to test.
Need growth-rate sorts across a rival panel? Install EagleReels free from the Chrome Web Store.
Last updated: June 5, 2026. EagleReels is not affiliated with Instagram or Meta. Public metrics and tool limits may change—verify on product sites before relying on client workflows.
Related articles:
Ready to track your Instagram Reels performance?
Download EagleReels Chrome extension and start analyzing your Reels today. It's free!
Download EagleReelsRelated Articles

Instagram Reels Competitor Tracker: How to Monitor Rivals in 2026
Learn how an Instagram Reels competitor tracker works—weekly workflow, tools compared, metrics to watch, and alternatives when Competitive Insights is not enough.

EagleReels vs IShort: Which Reels Chrome Extension Fits You?
Honest EagleReels vs IShort comparison for 2026—sort by views, multi-account tracking, view growth rate, CSV export, privacy, and free tier limits.

Data-Driven Instagram Reels Content Strategy (Competitor Data)
Build a data-driven Instagram Reels content strategy using competitor data—tracking workflows, growth signals, test calendars, and tools that beat guesswork.