Instagram Engagement Calculator: Calculate & Improve Your Rate in 2026
Learn how to calculate your Instagram engagement rate correctly, understand 2026 benchmarks, and discover proven strategies to improve your performance.

Why Your Instagram Engagement Rate Matters More Than Ever
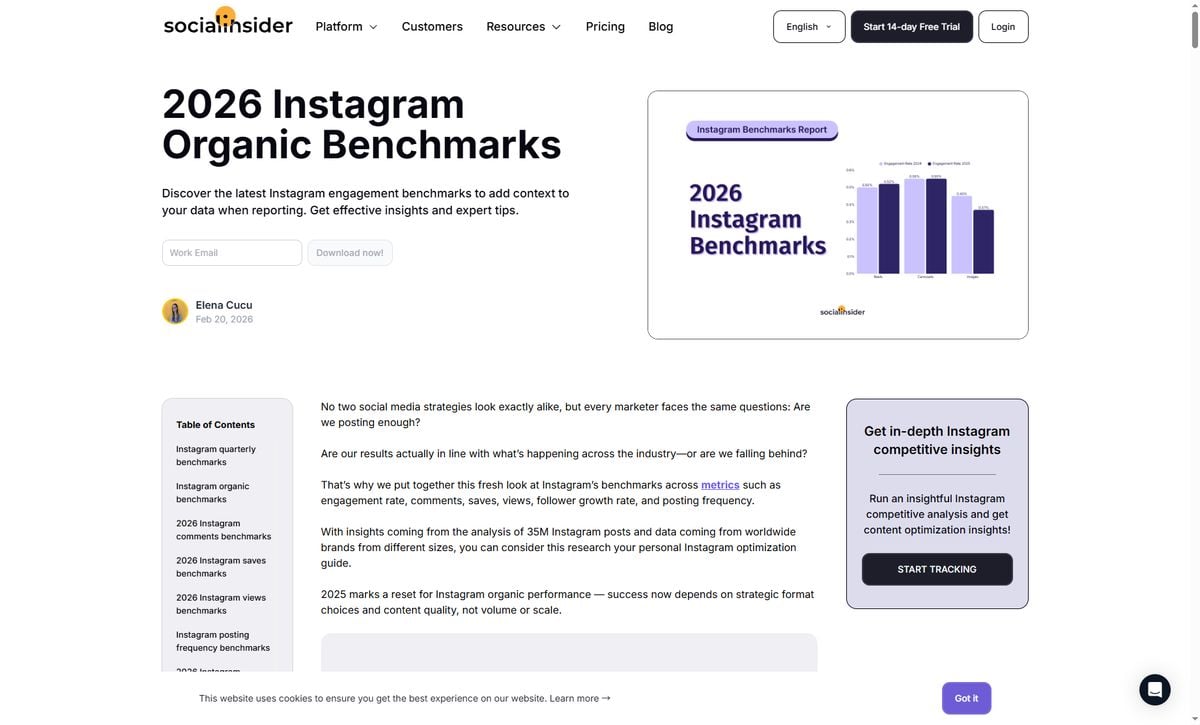
Your Instagram engagement tanking? Yeah, you're not alone. Get this: Instagram engagement rates crashed from 2.94% to 0.61% in just two years. That's a 79% nosedive (Digital Web Solutions, 2026). Brutal.
Real Talk from the Trenches:
"I watched my engagement rate drop from 4.2% to 1.8% in six months, and I had no idea why. Turns out, I was calculating it wrong the whole time."
— Jessica Martinez, lifestyle influencer with 45K followers
But here's where it gets weird. Try calculating your engagement rate with three different tools? You'll probably get three totally different numbers. One tool says 1.2%, another says 2.8%, and a third claims 4.1%. Which one is correct?
Industry Expert Weighs In:
"The biggest mistake I see brands make is comparing their engagement rate to industry averages without understanding which calculation method was used. A 2% engagement rate using one formula might be equivalent to 0.8% using another."
— Michael Chen, Social Media Strategy Director at Digital Growth Agency
In this guide, we'll cut through the confusion and show you:
- How to correctly calculate your Instagram engagement rate
- What's considered a "good" engagement rate in 2026
- Why different tools give you different numbers
- How to improve your engagement rate with proven strategies
The Engagement Rate Confusion: Why Numbers Don't Match
The Problem with "Standard" Formulas
Apaya's 2026 report dropped a bomb: when comparing engagement rates for the same industry, different reports showed numbers that varied by up to 26 times.
Check this out:
- Rival IQ says financial services hit 0.26%
- Hootsuite says 3.80%
- Same industry. 14.6x difference. Wild.
Why does this happen? Because there's no universal standard for calculating engagement rate.
Three Common Calculation Methods
Method 1: Basic Engagement Rate (Most Common)
Engagement Rate = (Likes + Comments) ÷ Followers × 100
- Pros: Simple, easy to calculate
- Cons: Ignores saves and shares
- Best for: Quick benchmarking
Method 2: Complete Engagement Rate (More Accurate)
Engagement Rate = (Likes + Comments + Saves + Shares) ÷ Followers × 100
- Pros: Captures all interactions
- Cons: Saves and shares data not always available
- Best for: Comprehensive analysis
Method 3: Reach-Based Engagement Rate (Brand Preferred)
Engagement Rate = (Total Interactions) ÷ Reach × 100
- Pros: Accounts for actual content visibility
- Cons: Reach varies per post
- Best for: Measuring content effectiveness
Which Method Should You Use?
For most creators and brands, we recommend Method 1 (Basic Engagement Rate) because:
- It's the industry standard
- Data is easily accessible
- It allows for consistent comparison over time
However, if you're analyzing specific posts or campaigns, Method 3 (Reach-Based) gives you a more accurate picture of how engaging your content actually is.
2026 Instagram Engagement Rate Benchmarks
Overall Average: The Reality Check
According to multiple industry reports, here's what "average" looks like in 2026:
| Data Source | Average Engagement Rate | Report Date |
|---|---|---|
| Social Insider | 0.48% | Q1 2026 |
| Sprout Social (RivalIQ) | 0.36% | 2026 |
| Digital Web Solutions | 0.61% | January 2026 |
Key Takeaway: If your engagement rate is between 0.36% and 0.61%, you're performing at the platform average.
Engagement Rate by Follower Count
Here's the truth: the more followers you have, the lower your engagement rate will be. This is completely normal.
| Follower Count | Average Engagement Rate | Category |
|---|---|---|
| 1K-10K (Nano) | 4-6% | Highest |
| 10K-50K (Micro) | 2-4% | High |
| 50K-100K | 1.5-3% | Medium |
| 100K-500K | 1-2% | Medium |
| 500K+ (Mega) | 0.5-1.5% | Lower |
Real Example (Another Common Mistake): A Reddit user with 8,000 followers shared: "I'm getting 3.2% engagement and thought it was bad until I saw these benchmarks. Turns out I'm actually doing great for my follower count!"
Wait — let's check the math:
- 8K falls in the 1K-10K (Nano) tier
- Benchmark for this tier: 4-6%
- At 3.2%, they're actually below the benchmark for their tier
- The mistake? They compared 3.2% to the platform average (0.36-0.61%) and felt good
- The reality: Compared to other nano accounts (4-6%), there's room for improvement
Lesson: Don't just compare to the platform average. Compare to accounts in YOUR follower tier. This user is doing better than average overall, but underperforming within their peer group.
Engagement Rate by Industry
Not all industries are created equal on Instagram. Here's what the data shows:
| Industry | Average Engagement Rate | Data Source |
|---|---|---|
| Higher Education | 2.1% | RivalIQ |
| Sports Teams | 1.3% | RivalIQ |
| Architecture/Manufacturing | 4.4% | Hootsuite |
| Education | 4.2% | Hootsuite |
| Health & Beauty | 0.44% | RivalIQ |
| Media | 0.44% | RivalIQ |
| Food & Beverage | 0.40% | RivalIQ |
| Financial Services | 0.26% | RivalIQ |
| Retail | 0.16% | RivalIQ |
Key Insight: Community-driven industries (education, sports, nonprofits) see much higher engagement than transaction-focused industries (retail, finance).
Engagement Rate by Content Format
In 2026, the content format you choose significantly impacts your engagement:
| Content Format | Average Engagement Rate | Performance |
|---|---|---|
| Carousels | 0.55% | Best |
| Reels | 0.50% | Good |
| Static Posts | 0.45% | Lowest |
Surprising Finding: Carousels now outperform Reels by 10%, marking a shift from 2024-2025 when Reels dominated.
How to Calculate Your Engagement Rate (Step-by-Step)
Manual Calculation
Step 1: Choose 10 recent posts (not including ads or promotions)
Step 2: For each post, add up:
- Likes
- Comments
Step 3: Calculate total engagement:
Total Engagement = Sum of (Likes + Comments) for all 10 posts
Step 4: Calculate average engagement per post:
Average Engagement = Total Engagement ÷ 10
Step 5: Calculate engagement rate:
Engagement Rate = (Average Engagement ÷ Your Follower Count) × 100
Example Calculation
Let's say you have 15,000 followers and your last 10 posts received:
- Total Likes: 4,200
- Total Comments: 180
- Total Engagement: 4,380
Average Engagement per Post = 4,380 ÷ 10 = 438
Engagement Rate = (438 ÷ 15,000) × 100 = 2.92%
Result: 2.92% is excellent for an account with 15K followers (well above the 2-4% benchmark for micro-influencers).
Using EagleReels for Automatic Tracking
Manual calculation works, but it's time-consuming. EagleReels automates this process by:
✅ Tracking Reels performance automatically — Monitor views, likes, and comments over time
✅ Calculating engagement scores per Reel — Uses a weighted formula: (Likes × 1 + Comments × 10) / Views
✅ Comparing with competitors — Benchmark your performance against similar accounts
✅ Identifying high-performing content — Sort by engagement score to find what's working
Why EagleReels' Engagement Score is Different:
- Comments weighted 10x more than likes — Because comments represent deeper engagement
- Based on views, not followers — More accurate for individual Reel performance
- Tracks growth over time — See which Reels are gaining momentum, not just initial performance
Unlike generic analytics tools that calculate account-level engagement rate, EagleReels focuses on per-Reel engagement scoring, helping you identify which specific pieces of content drive the most meaningful interactions.
What's a "Good" Engagement Rate in 2026?
Based on data from Sprout Social and CreatorFlow, here's how to interpret your engagement rate:
| Engagement Rate | Rating | What It Means |
|---|---|---|
| < 0.43% | Below Average | Review your content strategy |
| 0.43%-1% | Average | Typical for most brand accounts |
| 1%-3% | Good | Top 25% of accounts |
| 3%-6% | Excellent | Highly engaged community |
| 6%-10% | Outstanding | Rare, typically small accounts |
| 10%+ | Exceptional | Usually accounts under 5K followers |
Important Note: A 0.5% engagement rate for a 500K-follower account is actually better than a 2% engagement rate for a 2K-follower account. Context matters!
Why Your Engagement Rate Dropped (And What to Do)
Common Reasons for Declining Engagement
1. Algorithm Changes
Instagram's algorithm underwent significant updates in late 2025 and early 2026, prioritizing:
- Original content over reposts
- Carousels over static posts
- Longer watch time on Reels
2. Increased Competition
With more creators and brands on Instagram, your content competes with more posts in users' feeds.
3. Audience Fatigue
Posting too frequently or using repetitive content formats can lead to declining engagement.
4. Inactive Followers
As your account grows, you accumulate inactive followers who don't engage, lowering your overall rate.
Real User Experience
A Reddit user shared in r/InstagramMarketing:
"Has anyone noticed a big drop in engagement this month? My views, likes, and comments have lost more than half their usual engagement in my last few posts."
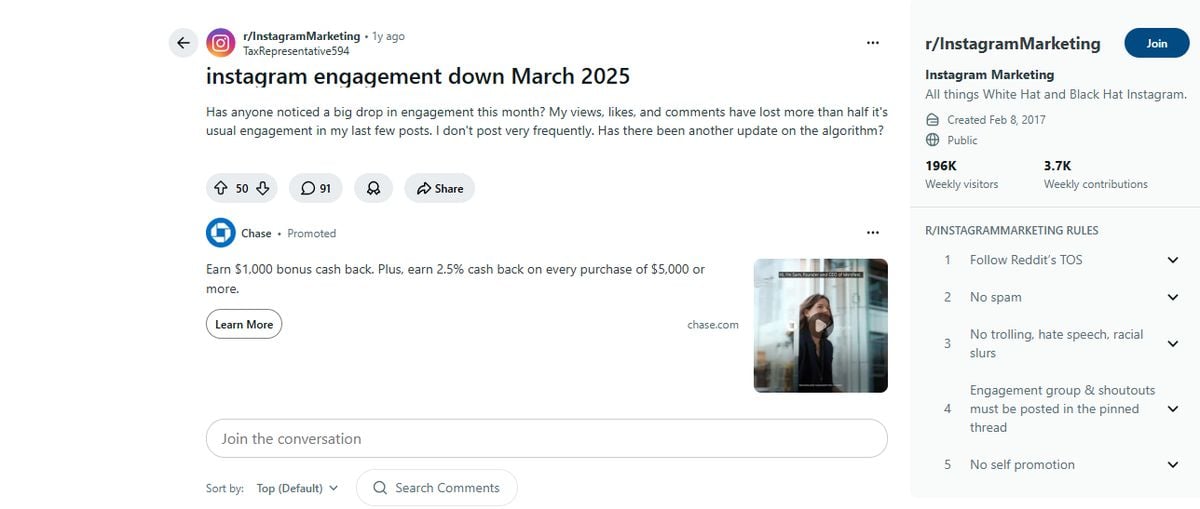
This is a common experience in 2026. The good news? There are proven strategies to recover.
10 Proven Strategies to Improve Your Engagement Rate
1. Prioritize Carousels Over Static Posts
Data: Carousels achieve 22% higher engagement than static posts in 2026.
Action: Create multi-slide posts that tell a story or provide value across 5-10 slides.
2. Optimize Your Reels for Watch Time
Why: Instagram's algorithm prioritizes Reels that keep viewers watching.
Action:
- Hook viewers in the first 1-2 seconds
- Keep Reels between 7-15 seconds for maximum retention
- Use trending audio (but make it relevant to your content)
3. Post When Your Audience Is Active
Data: Posting at optimal times can increase engagement by 30-50%.
Action: Check Instagram Insights to find when your followers are most active, then schedule posts accordingly.
4. Use Strong Calls-to-Action (CTAs)
Why: Explicit CTAs increase engagement by 15-20%.
Examples:
- "Double-tap if you agree"
- "Comment your favorite below"
- "Save this for later"
- "Share with someone who needs this"
5. Respond to Comments Quickly
Data: Accounts that respond to comments within 1 hour see 15-20% higher engagement.
Action: Set aside time immediately after posting to engage with early commenters.
6. Create "Saveable" Content
Why: Saves are a strong engagement signal to Instagram's algorithm.
Content Types:
- Tutorials and how-to guides
- Templates and resources
- Tips and checklists
- Infographics
7. Collaborate with Other Creators
Why: Collaborations expose your content to new audiences with similar interests.
Action: Use Instagram's Collab feature to co-author posts and Reels.
8. Ask Questions in Your Captions
Why: Questions naturally encourage comments.
Examples:
- "What's your biggest challenge with [topic]?"
- "Which option do you prefer: A or B?"
- "Have you tried this? Let me know in the comments!"
9. Analyze Your Top-Performing Content
Action:
- Review your last 30 posts
- Identify the top 5 by engagement rate
- Look for common patterns (format, topic, style)
- Create more content like your winners
Pro Tip: Use EagleReels to track which of your Reels are gaining momentum over time, not just initial performance.
10. Clean Up Your Follower List
Why: Inactive followers drag down your engagement rate.
Action:
- Remove obvious bot accounts
- Consider removing followers who haven't engaged in 6+ months
- Focus on attracting quality followers, not just quantity
Tracking Your Progress: What to Monitor
Key Metrics Beyond Engagement Rate
While engagement rate is important, track these metrics for a complete picture:
1. Engagement Rate Trend
- Is it improving or declining over time?
- More important than a single snapshot
2. Engagement by Content Type
- Which formats (Reels, Carousels, Static) perform best?
- Double down on what works
3. Engagement by Topic
- Which topics resonate most with your audience?
- Create more content around high-engagement topics
4. Follower Growth Rate
- Are you attracting new followers?
- Quality matters more than quantity
5. Reach and Impressions
- How many people are seeing your content?
- Low reach might indicate algorithm issues
How EagleReels Helps
EagleReels specializes in Reels performance tracking, offering:
- Automatic data collection — No manual spreadsheets needed
- Per-Reel engagement scoring — Weighted formula:
(Likes × 1 + Comments × 10) / Views - Competitor benchmarking — See how your engagement compares
- Trend identification — Spot patterns in your best-performing content
Why the weighted formula matters: Comments represent 10x deeper engagement than likes. A Reel with 1,000 views, 50 likes, and 10 comments gets an engagement score of (50 + 100) / 1000 = 0.15, while one with 100 likes but 0 comments only scores 0.10 — even though it has more total interactions.
Common Engagement Rate Mistakes to Avoid
Mistake 1: Comparing Yourself to the Wrong Accounts
Problem: Comparing your 50K-follower account to a 5K-follower account.
Real Example:
A sustainable fashion brand with 85K followers calculated their engagement rate at 1.2%. The founder panicked: "We're below the 2-4% benchmark!"
The mistake? That 2-4% benchmark was for micro-influencers (10K-50K followers), not 85K accounts.
The reality:
- For 85K followers, the benchmark is 1.5-3%
- For retail industry: 0.16% average
- Their 1.2% was actually 7.5x better than retail average
Solution: Always compare within your follower tier AND industry. A 50K account with 2% engagement is doing better than a 5K account with 4% in absolute terms.
Mistake 2: Focusing Only on Vanity Metrics
Problem: Chasing likes and comments without considering business goals.
Solution: Track metrics that align with your objectives (website clicks, DM inquiries, sales).
Mistake 3: Buying Followers or Engagement
Problem: Fake followers and engagement destroy your authentic engagement rate.
Solution: Grow organically, even if it's slower.
Mistake 4: Posting Too Frequently
Problem: Overwhelming your audience leads to lower engagement per post.
Solution: Quality over quantity. 3-5 high-quality posts per week is better than daily mediocre content.
Mistake 5: Ignoring Your Analytics
Problem: Creating content without understanding what works.
Solution: Review your analytics weekly and adjust your strategy accordingly.
Frequently Asked Questions
Frequently Asked Questions
Conclusion: Focus on Trends, Not Just Numbers
Here's the most important takeaway: your engagement rate trend matters more than the absolute number.
A 0.8% engagement rate that's growing is better than a 2% engagement rate that's declining.
Your Action Plan
- Calculate your current engagement rate using the formula in this guide
- Compare it to the benchmarks for your follower count and industry
- Identify your top-performing content and create more like it
- Implement 2-3 strategies from our list of 10 proven tactics
- Track your progress weekly using Instagram Insights or tools like EagleReels
- Adjust your strategy based on what the data tells you
Ready to Track Your Reels Performance?
If you're serious about improving your Instagram engagement, you need to understand which Reels are driving results.
EagleReels makes it easy to:
- Track Reels performance automatically
- Identify which content is gaining momentum
- Compare your performance with competitors
- Make data-driven content decisions
Free for up to 5 tracked accounts — no credit card required.
About the Author: This guide is based on data from Sprout Social, Social Insider, Digital Web Solutions, and real user experiences from Reddit's Instagram marketing communities. All statistics are current as of May 2026.
Last Updated: May 20, 2026
Ready to track your Instagram Reels performance?
Download EagleReels Chrome extension and start analyzing your Reels today. It's free!
Download EagleReelsRelated Articles
Instagram Growth Strategy 2026: Complete Guide to Organic Growth
Master Instagram growth strategy in 2026 with proven tactics, algorithm insights, and realistic timelines. Learn what actually works for organic follower growth.

Instagram Follower Tracker: Monitor Growth & Analytics 2026
Discover the 5 best Instagram follower tracker tools in 2026. Compare features, pricing, and find the perfect tool to monitor your growth, track unfollowers, and analyze engagement.